Widget
- 22 Aug 2023
- 3 Minutes to read
- Print
- DarkLight
- Download PDF
Widget
- Updated on 22 Aug 2023
- 3 Minutes to read
- Print
- DarkLight
- Download PDF
Article summary
Did you find this summary helpful?
Thank you for your feedback!
In Atomic Scope all the analytics are done via dashboards.
Each dashboard consists of a number of predefined and custom widgets that you can configure using a search query.
Predefined widgets
Tracking by results
Tracking Results by Business process
Tracking Results by Transactions
Tracking Results by Batch Transactions
Tracking Results by Integration type
Reprocess
Dead Letters
Monitoring
Business Process configuration
Tracking by results
Tracking Results by Business process
Tracking Results by Transactions
Tracking Results by Batch Transactions
Tracking Results by Integration type
Reprocess
Dead Letters
Monitoring
Business Process configuration
Predefined widget
By default, installation of the Atomic Scope - the user can understand the important details.
Predefined Widgets
- Overview
- Current status of Atomic Scope Service
- The size of the Atomic Scope Database, including its available and used portions.
- The total number of transactions in the active business processes.
- Number of successful, unsuccessful, and pending transactions.
Once the user adds the new dashboard or widget, the user can add the widget as required from the list. Also the user can add the custom widget by using search query o
Report Types
Atomic Scope currently supports four report types:
- Time Series – A basic time series chart with time on the X-axis and transaction count on the Y-axis
- Multi-Time Series – A multi-time series is similar to time series
- Top Chart – For any of the tracked properties you will be able to find the most popular values using this report type
- Count – This is just a count only report for the provided data
Tracking Results by Status
There are three major categories
- Success Transactions - Success Transactions available in specific Workspace.
- Inprogress Transactions - Inprogress Transactions available in specific Workspace.
- Failed Transactions - Failed Transactions available in specific Workspace.
Report types and Group by supports in this widget are given below:
| Report types | Chart types | Group By |
|---|---|---|
| Time series |
| NIL |
| Top Chart |
|
|
| Multi time series |
|
|
| Count | NIL | NIL |
Date Range
- Last 24 Hours
- Last 7 Hours
- Last 30 days
- Custom -(Hours)
Transaction Results by Business Process
The result will be displayed using this widget's business process level. Every business process set up under workspace will be displayed.
Report types | Chart types | Group By |
Time series |
|
NIL |
Top Chart |
|
|
Multi time series |
|
|
Count | NIL | NIL |
Tracking Results by Transactions
This widget will show all the transactions under business process. We can create the widgets in transactions level.
Report types | Chart types | Group By |
Time series |
| NIL |
Top Chart |
|
|
Multi time series |
|
|
Count | NIL | NIL |
Tracking Results by Batch Transactions
This widget will show the results of batch transactions.
Report types | Chart types | Group By |
Time series |
|
NIL |
Top Chart |
|
|
Multi time series |
|
|
Count | NIL | NIL |
Tracking Results by Integration Type
This widget will show the result by integration type level. Only that specific integration type transaction result will shown
1. BizTalk Transactions
2. LogicApp Transactions
3. APIM Transactions
4. Custom API Transactions
5. Azure function Transactions
6. Hybrid Transactions
Report types | Chart types | Group By |
Time series |
|
NIL |
Top Chart |
|
|
Multi time series |
|
|
Count | NIL | NIL |
Reprocess
In this widget, reprocess-related results will shown.
- Assign Reprocess By Status
Report types | Chart types | Group By |
Top Chart |
|
|
Count | NIL | NIL |
- Assign Reprocess By AssignedTo
Report types | Chart types | Group By |
Top Chart |
|
|
Count | NIL | NIL |
- Reprocess Results
Report types | Chart types | Group By |
Top Chart |
|
|
Count | NIL | NIL |
Dead letter
In this widget to display all dead letter occurred during process message async tracking with specified duration.
- Dead letters
Report types | Chart types | Group By |
Time series |
|
NIL |
Top Chart |
|
|
Multi time series |
|
|
Count | NIL | NIL |
Monitoring
In this widget, the user can view the results of the alert history.
Alert history by query alert
The widget will display query alert history during the specific time interval.
Report types | Chart types | Group By |
Time series |
|
NIL |
Top Chart |
|
|
Multi time series |
|
|
Count | NIL | NIL |
Alert history by Exception alert
Report types | Chart types | Group By |
Time series |
|
NIL |
Top Chart |
|
|
Multi time series |
|
|
Count | NIL | NIL |
Business process configuration
This widget will display the business process configuration details by results.
Number of Business Transactions
Report types | Chart types | Group By |
Top Chart |
|
|
Count | NIL | NIL |
Tracking Disabled
This widget display all tracking disabled business process count
Add custom widget
If user want to get the overall transactions for that particular business process for the past X number of days.
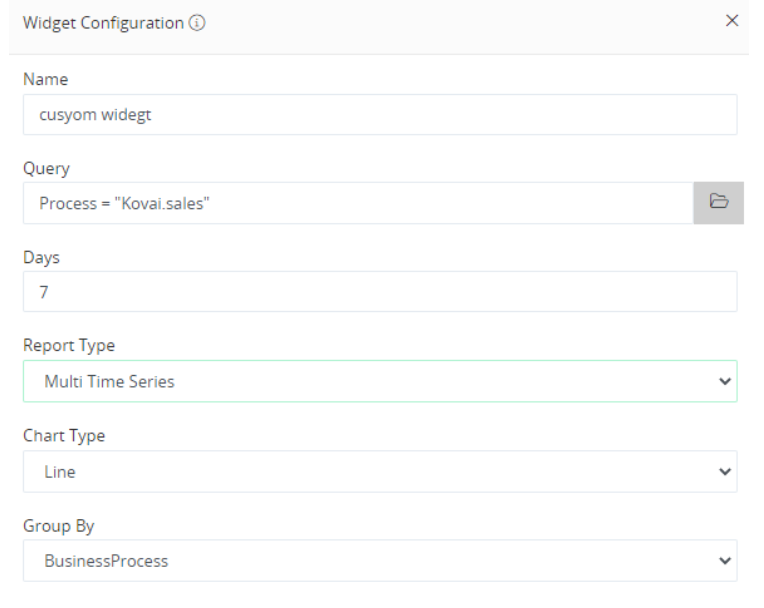
Each widget configuration has three main configuration settings. Name of the widget, Report Type and query.
The widget configuration query works the same way as in the Tracking search page.
With Atomic Scope, customers can also choose the type of chart that they might want on the widgets depending upon their requirement.
.gif)
Was this article helpful?