Alert Configuration
- 22 Aug 2023
- 4 Minutes to read
- Print
- DarkLight
- Download PDF
Alert Configuration
- Updated on 22 Aug 2023
- 4 Minutes to read
- Print
- DarkLight
- Download PDF
Article summary
Did you find this summary helpful?
Thank you for your feedback!
Monitoring is an essential part of any integration project, within AtomicScope you will immediately notified when an exception happens in any of your transactions. AtomicScope uses your own SMTP servers to send alerts in a form of an email to people who need to know about transaction issues.
Exception Alert Configuration
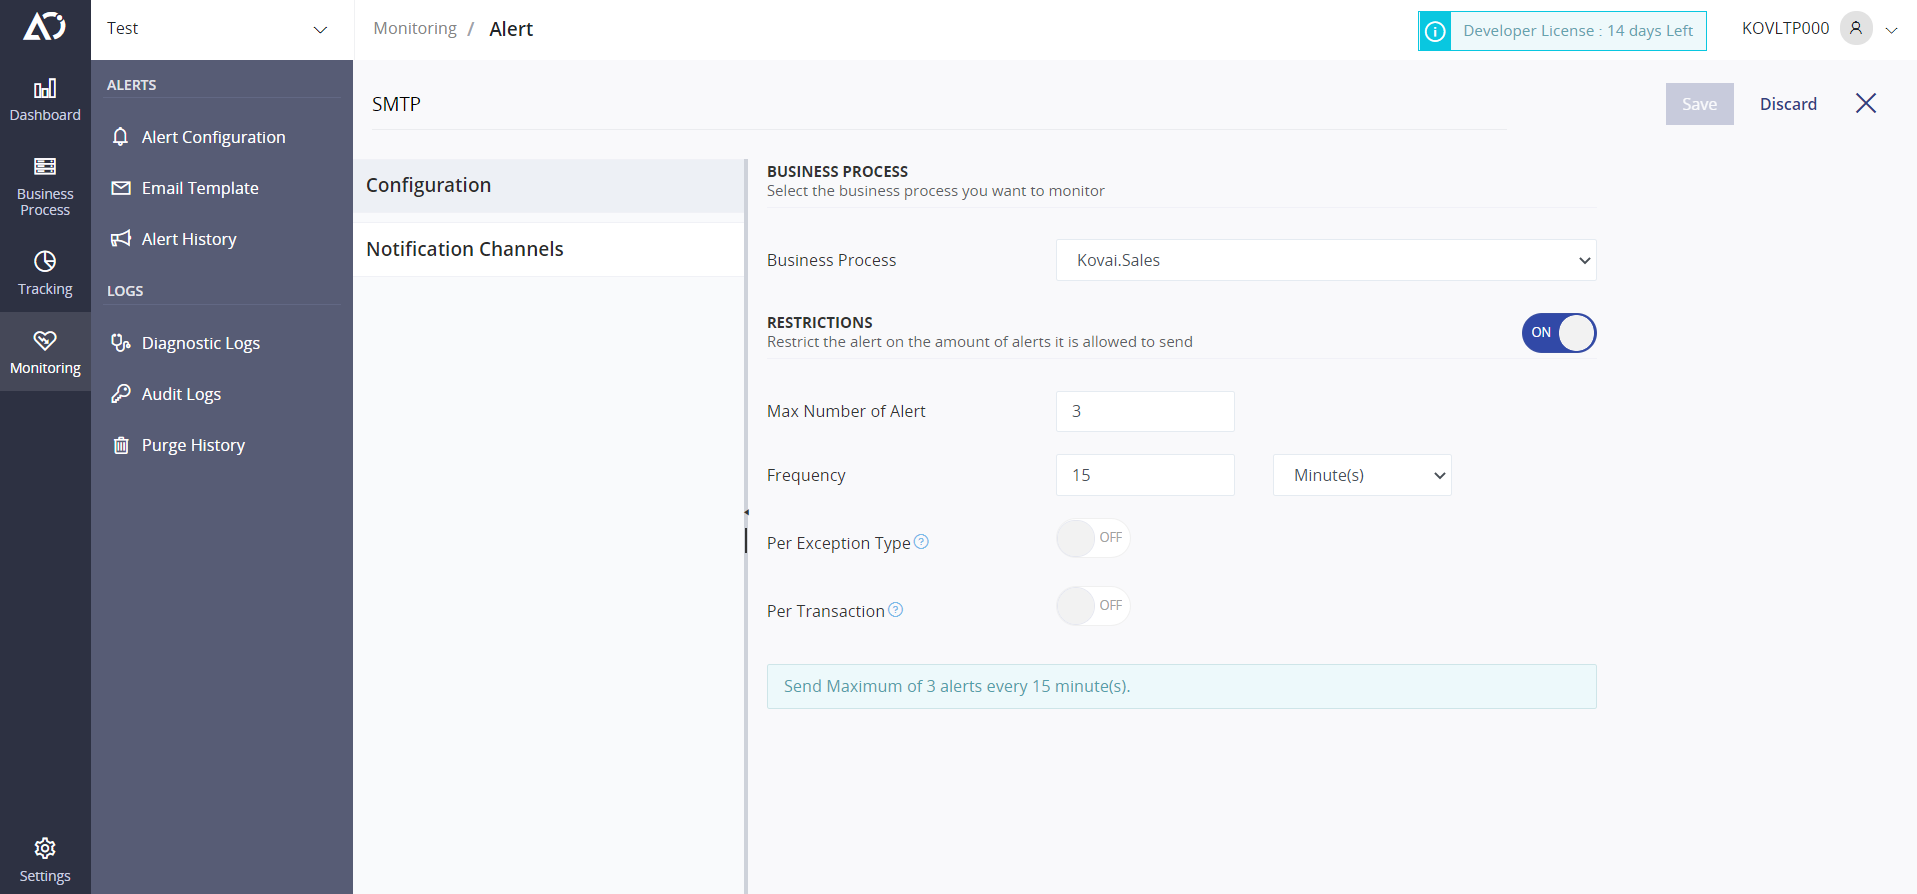
To configure monitoring head over to the Monitoring section inside the portal. Click on Alert and select the type of alert which you want to configure.In the list of processes click on the one which you want to enable monitoring. Select the configuration and choose the type of Notification channel to send alerts.
There are three sections in the monitoring configuration with restrictions being the optional. To enable monitoring simply provide alert name, choose business process and select at least one notification channel. Save your new configuration and from that point Atomic Scope will monitor for any exceptions in your transactions.
The restrictions part of the configuration will prevent you from getting flooded with notificati when there is an issue with multiple messages in the same business process or transaction. Once you enable restriction the UI will be updated with some additional fields to be populated:
- Max Alerts – this is the maximum number of alerts before AtomicScope will stop sending the alerts.
- Frequency – This is how often does the maximum number of alerts reset back to 0. For example, if you have Max Alerts set to 3 and Frequency 10 minutes, it will instruct AtomicScope to only send maximum of three alerts within 10-minute window.
- Per Exception Type – If you enable this option the maximum number of alerts will now be filtered by exception type. If we take the same figures from example above it will mean that you can receive up to 3 alerts within 10-minute window for each exception type. There are two exception types in AtomicScope so the total of alerts will be 6.
- Per Transaction – without this option the alert count is taken globally for the business process, if you enable this option the Max Alert count will be applied for every transaction in that business process. Therefore, if you have 2 transactions and one of them already reached max alert, the other will continue to send alerts until it also reaches the max alert count.
At the bottom of the restrictions section there is also a blue info box which updates the description of the restriction as you change it.
Query Alert Configuration
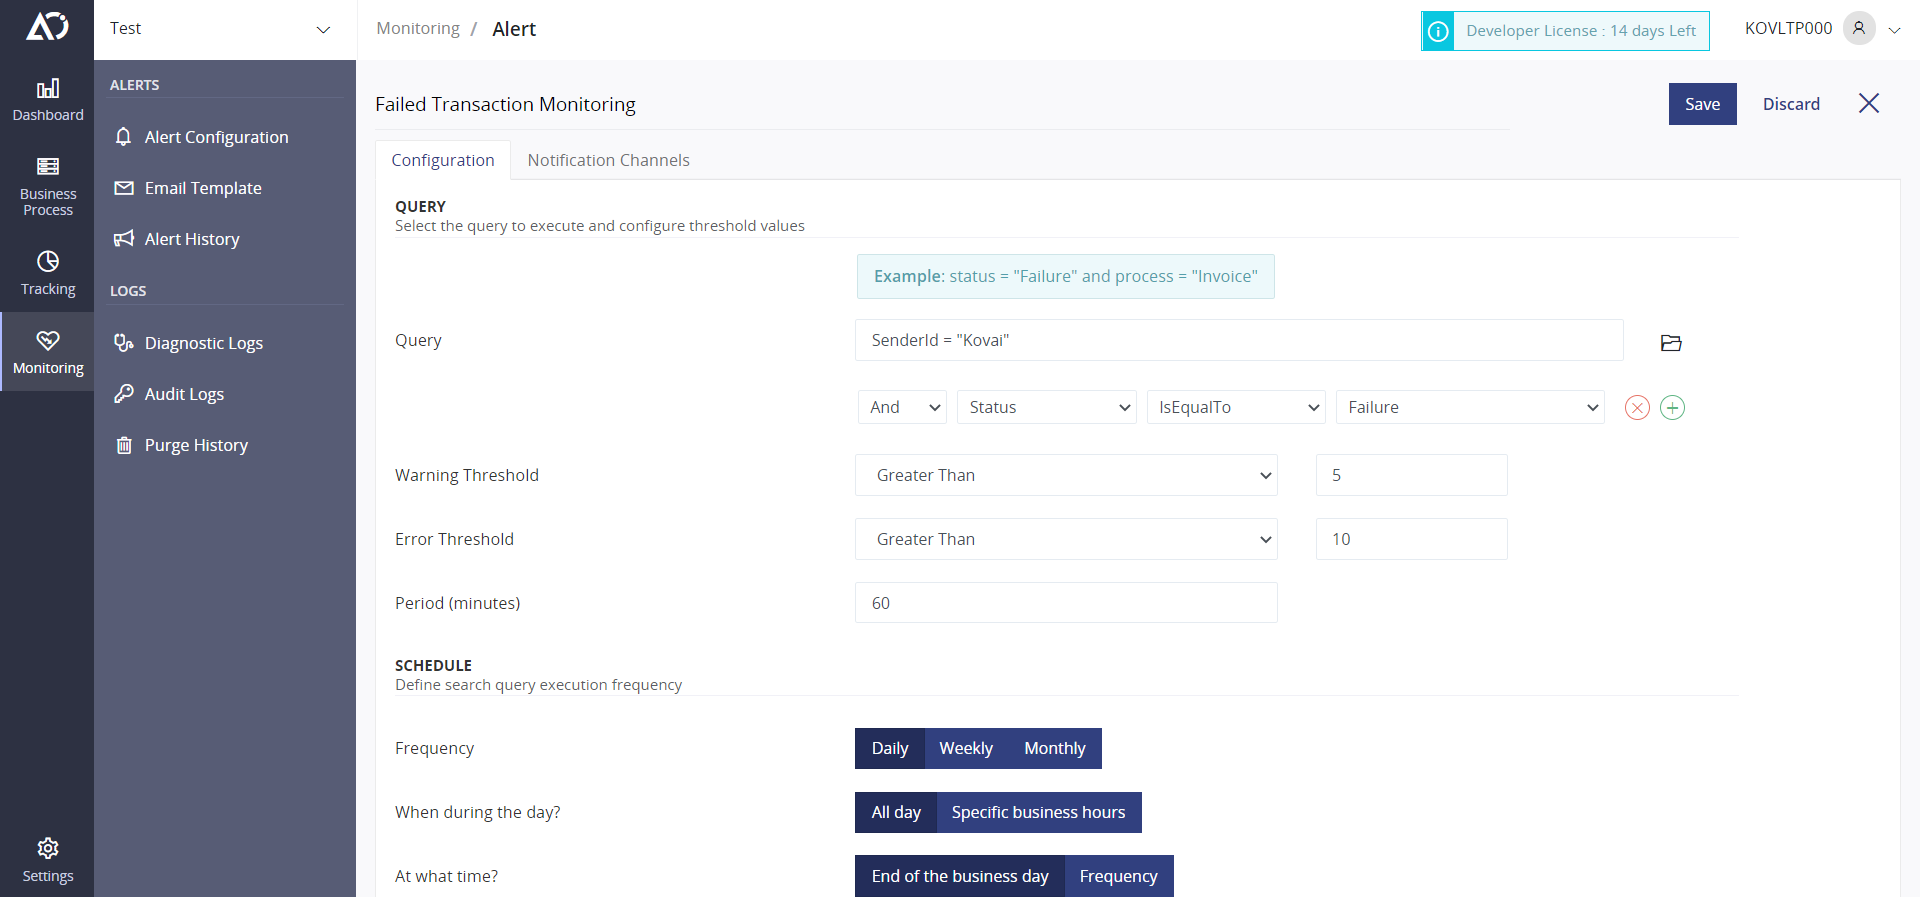
Query monitoring provide the ability to monitor existing queries or new queries against specified threshold values and operators. The query will be executed based on a custom schedule configured inside the alert. Once the configuration is successfully saved, windows service will fetch it from the database and calculate the next run date based on the defined schedule.
The monitoring subservice will constantly monitor all configurations and execute them when required. The total count which is returned by the query will be validated against the configured operator and value, if a count matches any of the threshold values a notification is generated and then sent to all the mapped notification channels.
Configuration
The configuration of query alerts can be found in the “Monitoring” sub-section called “Alerts”. Select “Query Alerts” from the tabs and click on the “Add new query alert” button to open configuration page.
Search Query
Query - this will be the query that will be executed, the value can be typed in manually with predefined filters or can be auto populated from the already saved queries by clicking on the folder button.
Warning & Error Threshold - This is the configurable value that will be compared against the query execution results. If the returned query result count matches the operator and the value e.g. returned value is 11 which is “Greater Than 10“ the query will be set to that state and notification will be sent out. If the returned result does not match any of the threshold values, the result will be ignored and verified again at the next execution date.
Period - will filter the data for the last X number of minutes since the query execution.
Schedule
Frequency - how often do you want to run the query:
- Daily - will execute the query every day.
- Weekly - will execute the query only on selected days.
- Monthly - will execute the query on specific day of the month, if that day does not exist in the current month e.g 31st the execution will be skipped.
When During the Day? - On the execution day, specify the time range when the execution must happen. All day will execute from 00:00 till 23:59, by selecting “Specific Business Hours” the range can be customised to the desired values.
At What Time? - Lastly the time of the execution must be specified. “End of the business day” will execute the query on the last hour of the time range specified before. “Frequency” will allow to select continuous execution every X number of minutes or hours (Minimum value is 5 minutes)
Notification Channels
The configuration requires the user to select at least one notification channel that can be triggered on threshold match. You can read more about notification channel configuration [here]
Was this article helpful?