Analytics
- 12 Jul 2021
- 2 Minutes to read
- Print
- DarkLight
- Download PDF
Analytics
- Updated on 12 Jul 2021
- 2 Minutes to read
- Print
- DarkLight
- Download PDF
Article summary
Did you find this summary helpful?
Thank you for your feedback!
Why Analytics?
Until version 3.0, we mainly focused on tracking the data from different integration components. We had a solid search feature, which enabled customers to find relevant transactions that they are looking for.
Today, most business processes happen in real time environments. But the search feature that we had is only useful when you know exactly what you are looking for and the search results will only be shown as individual transactions.
But most of the business users would require an aggregate of information, like how exactly is business process X doing. Is there any anomaly in the number of transactions etc. This kind of information can only be obtained based on data trends. Any kind of data trends needs a chart to properly understand.
For example, let’s take supply chain industry to consider the business process of Order Processing.
What are all the possible analytics information that you might need? Just to mention a few:
Overall transactions for that particular business process for the past x no. of days
What are all the top vendors for the particular business process?
What are all the success/failures rates for that business process?
Let’s see how we can achieve this in Atomic Scope.
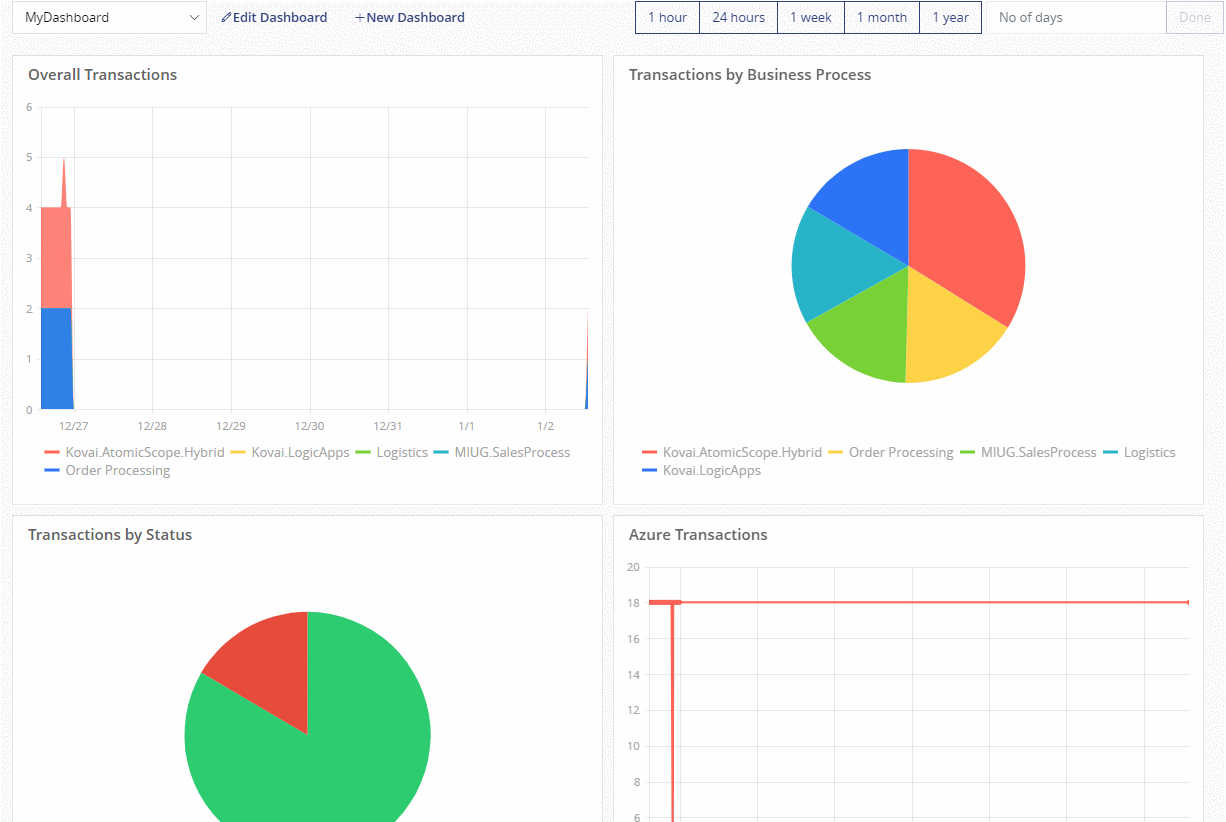
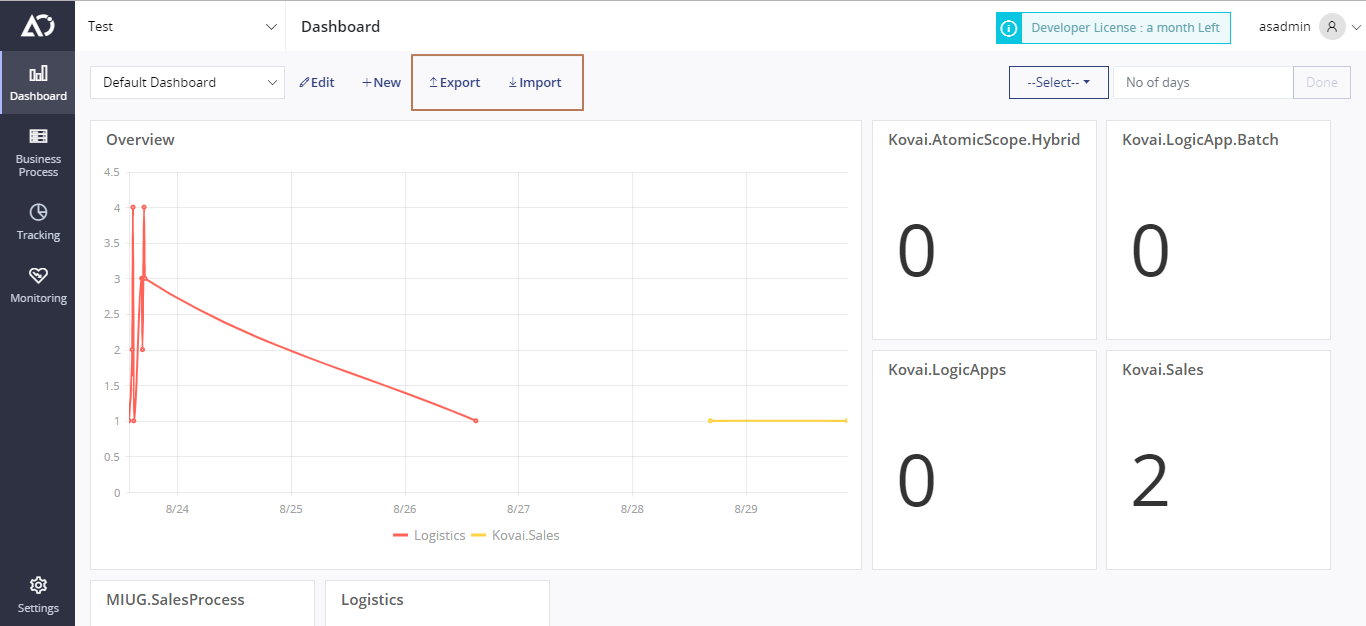
Dashboards
In Atomic Scope all the analytics is done via dashboards. Each dashboard consists of a number of custom widgets that you can configure using a search query.
Report Types
Atomic Scope currently supports four report types:
Time Series – A basic time series chart with time on the X-axis and transaction count on the Y-axis
Multi-Time Series – A multi-time series is similar to time series, but you can also add a Group By for any global property
Top Chart – For any of the tracked properties you will be able to find the most popular values using this report type
Count – This is just a count only report for the provided data
Let’s see how the widget creation blade looks like for each of the above queries.
Overall transactions for that particular business process for the past x no. of days.
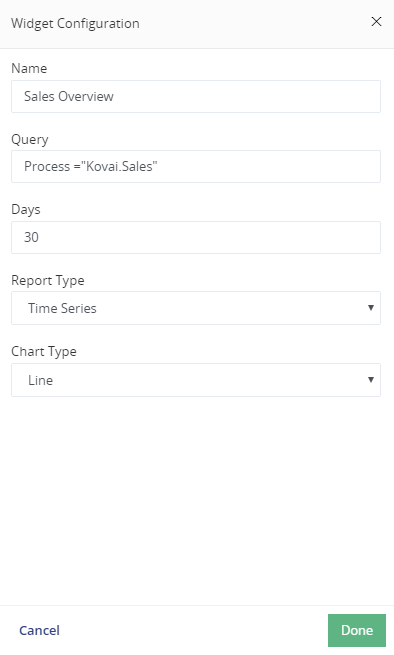
Each widget configuration has three main configuration settings. Name of the widget, Report Type and query.
The widget configuration query works the same way as in the Tracking search page.
With Atomic Scope, customers can also choose the type of chart that they might want on the widgets depending upon their taste.
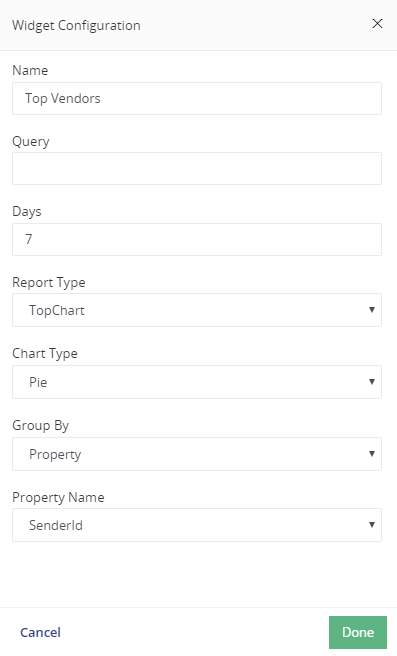
What are all the top vendors for a particular business process?
Let’s assume we have a global property called SenderId. This property captures different vendor names in the business process. Now if you want to get the top vendors, you can configure something like below in our widget configuration.
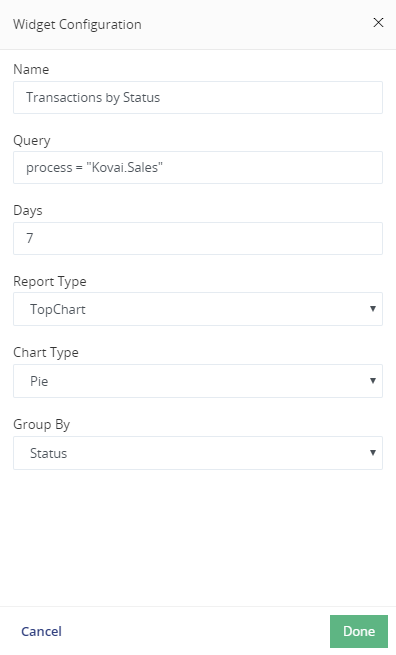
What are all the success/failures rates for that business process?
Import/Export Dashboards
You should be able to import and export dashboards similar to import/export business process.
Was this article helpful?